The HR Intelligence engine
The HR Intelligence engine: software built for the reality of HR data.
Know your data is right. Then act on it with confidence.
To do this work faster and more accurately, I designed and built my own tool: the HR Intelligence engine. It is a browser-based, privacy-by-design analytics engine that I use to deliver my consultancy.
It does the heavy lifting of absorbing your raw HR exports (CSV or Excel), mapping the columns to over 150 canonical fields, and building a clean, historical model. Crucially, your data never leaves your machine. It reads everything in your browser, without sending your data anywhere.
The engine does not learn by itself, it does not certify accuracy, and it never makes employment decisions. Instead, it surfaces the hidden patterns and signals in your data for us to investigate together.
-
Step 1
Your Raw Data
Headcount, leavers, absence, performance, and legacy spreadsheets. Drop them in exactly as they are.
-
Step 2
Processed In-Browser
The engine audits, maps, collates, and links the data directly on your machine. Nothing is ever uploaded to Help Studios.
-
Step 3
The Output
Ranked signals, a risk Watch Register, and a fully reconciled, board-ready export.
Tested against deliberately hostile files: nine exports carrying 24 habits of real HRIS and spreadsheet extracts (report titles above the header, totals inside the data, several date formats, differently padded ids, European number formats, a pivot-shaped file). 19 were handled correctly first time, 5 were flagged for a person to decide, and none was silently read wrong. The audit of all nine took 3.8 seconds on a laptop, including opening the browser.
How it reads your systems
Any system. Any mix. One model.
The same person is a 'Worker' in Workday, an 'Assignment' in Oracle, and a row in a legacy spreadsheet. I map every system onto one unified vocabulary. The headcount in your board pack and the leavers in your tracker finally describe the exact same people.
You do not have to run one of these. Workday, Oracle Fusion HCM, SAP SuccessFactors, Core HR (People XD), BambooHR, iTrent, ResourceLink, ADP and Sage HR are the systems whose column names the engine already knows, and an Excel or CSV export covers everything else. Load one of them, or all of them, or a different vendor in every country — the engine merges whatever it is given into the same model, and a system it has never seen is read from its headers rather than turned away.
Your core HRIS, whichever it is
- Workday Supervisory Organization Core HR export
- Oracle Fusion HCM ORGANIZATION_NAME Core HR export
- SAP SuccessFactors department Core HR export
- BambooHR Department Core HR export
- Excel export Dept Tracker (EUC)
- …and however many more their own names their own exports
Any number of vocabularies. Unlinked insights.
In your browser
- Department
- Headcount
- Leaver date
- Leave reason
- FTE
One vocabulary. Never uploaded.
One linked view
- Voluntary attrition · rolling 12 months Leavers
- Retention risk · Watch Register Insights
- Board-ready Power BI dataset All sources
Every figure traces back to a file.
Field map
Selected system: Workday
| Unified model | Workday field |
|---|---|
| Employee Reference | Worker_ID |
| Department | Supervisory_Organization |
| Job Title | Job_Profile_Name |
| Grade | Grade |
| Full Time Equivalent | FTE |
| Legal Gender | Gender |
| Ethnicity | Ethnicity |
| Date of Birth | Date_of_Birth |
| Start Date | Hire_Date |
| Manager Reference | Manager_ID |
| Cost Centre | Cost_Center_ID |
| Location | Location |
| Leave Date | Termination_Date |
Workday names all 13 of these columns in its own vocabulary.
Names are read from the engine's own field registry — 180 canonical fields, a vocabulary for each of ten systems, and 1,176 spellings the mapper resolves across the headcount, absence and leavers exports. These thirteen are the engine's headcount template, kept to the columns whose own name resolves to the field they belong to. A muted name is the engine's template column rather than the system's word: that vocabulary has no name for the column, so the engine reads your header, or you map it once on upload — which is why a system listed above with a short vocabulary, or one not listed at all, still gets the same model. Load one source or every source; they merge. Headcount is not a column anywhere — the engine counts rows — and leave reason and absence days arrive with the leavers and absence workbooks.
Showing Workday field names.
Guided tour
A guided tour of the product, on real screens.
These are the real screens from the running product, on a synthetic bank called Meridian Bank. Pick a step, or use the arrow keys.
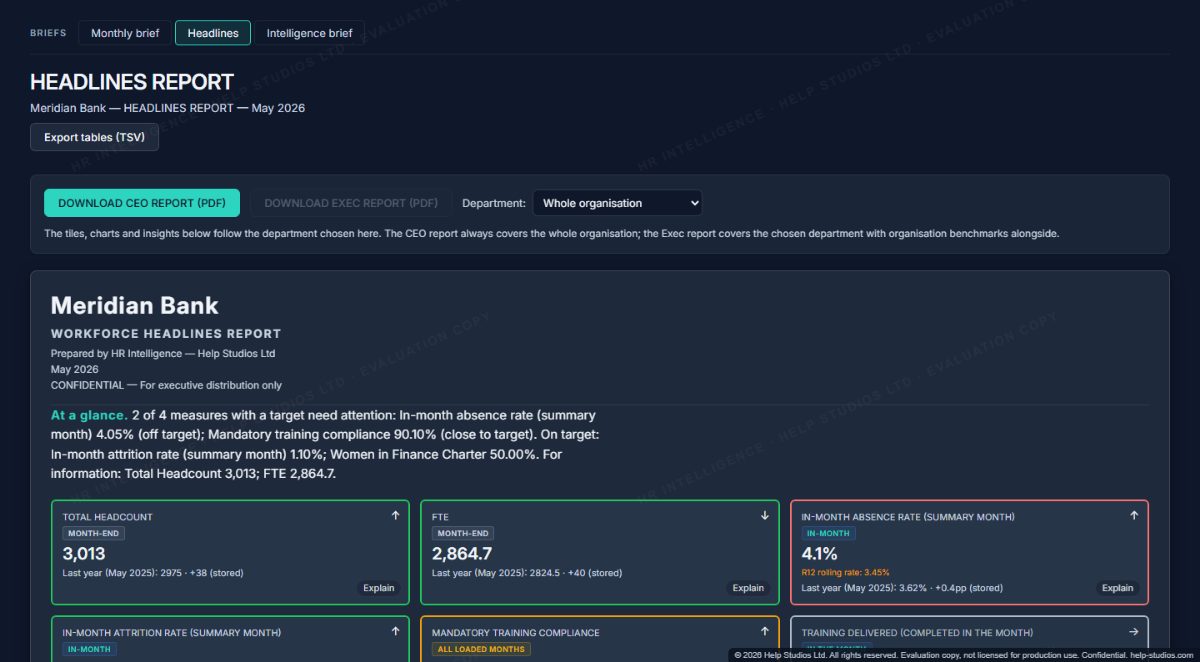
Step 1 of 5
Start with the answer
What does the board need to know this month?
- Heads and FTE, side by side 1,299 people are 1,274.6 full-time equivalents: part-time working is counted, not rounded away, and last year sits underneath.
- Red, amber or green against your own target The rate is judged against the target you set, not a number baked into the product, and it says so.
- One sentence for the board The screen writes its own summary: what needs attention, what is on target, what is for information.
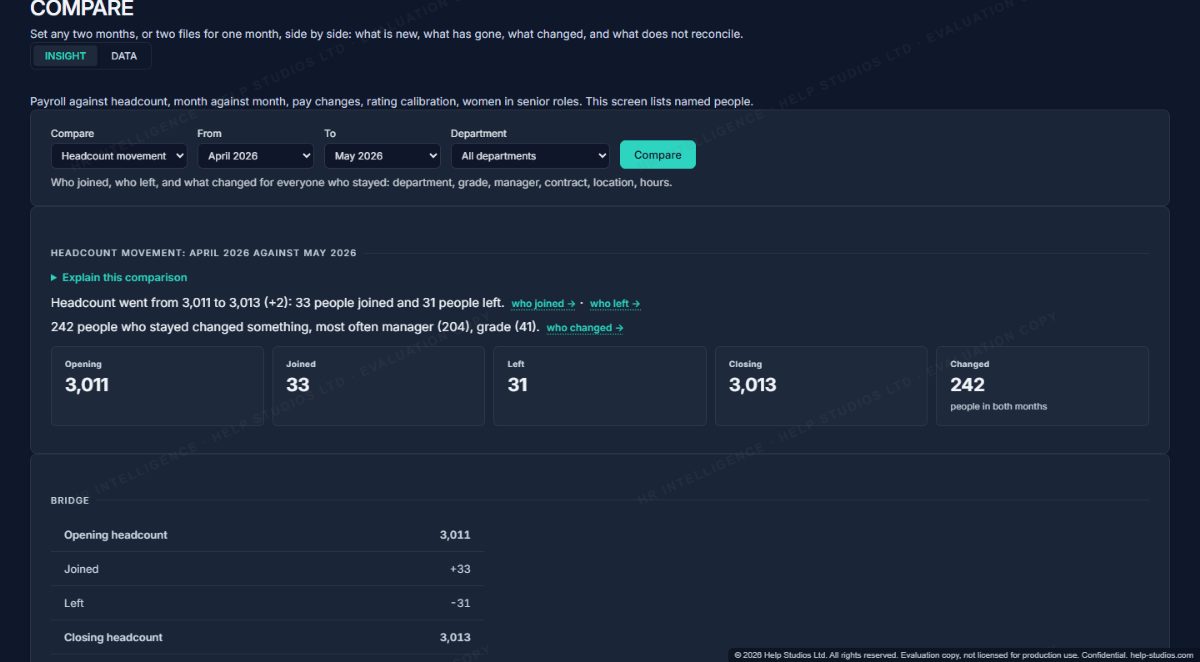
Step 2 of 5
Ask what changed
Who joined, who left, and does it add up?
- Plain words first Headcount held at 1,299: 26 joined and 26 left, and 25 people who stayed changed something.
- Every figure is a link Click joined, left or changed and see the named people behind the number.
- The bridge always adds up Opening plus joined minus left is closing. If it ever does not, the screen says so instead of hiding it.
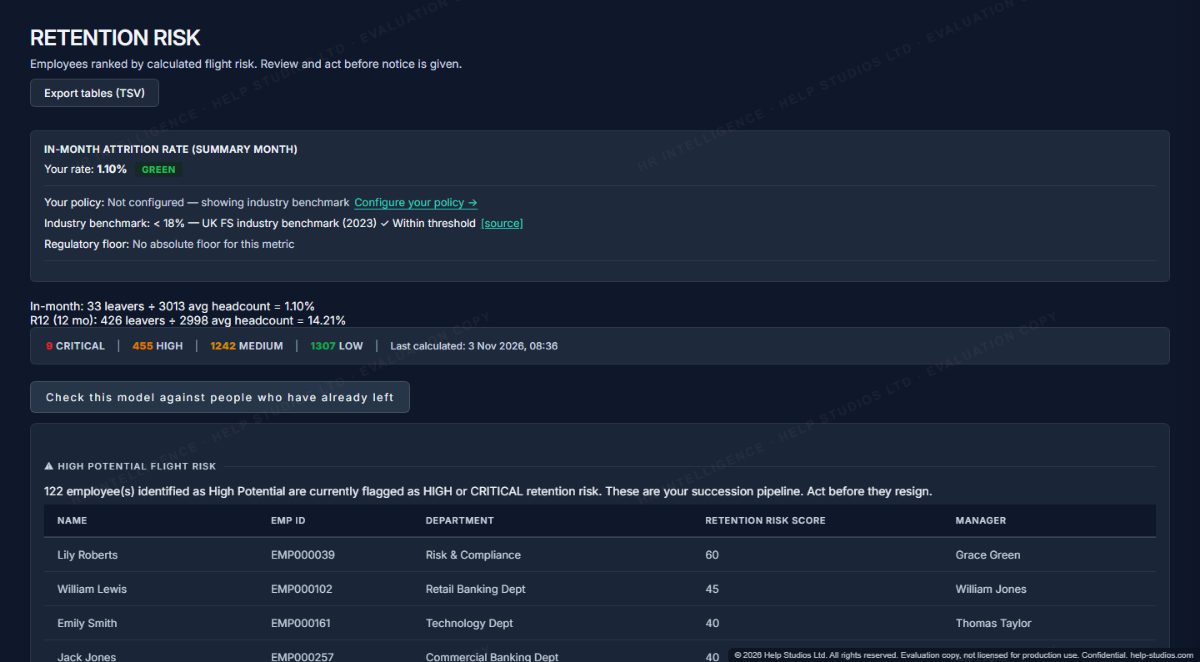
Step 3 of 5
Find who is at risk
Who is likely to leave, and what could we do first?
- Risk bands, not a verdict Critical, high, medium and low counts from the factors that are present. The engine surfaces the signal; HR investigates.
- Check it against history One click tests the model against people who have already left, so you can see whether it earns your trust.
- Your succession pipeline at risk High-potential people who are also flagged as high risk: the ones to talk to before they resign.
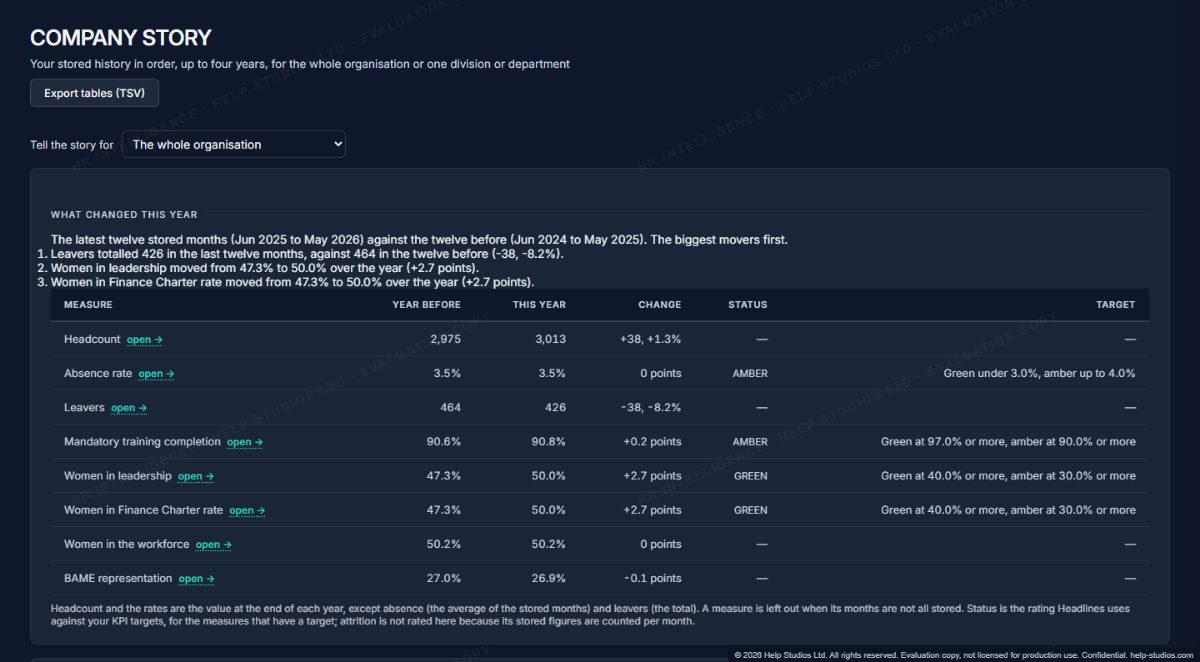
Step 4 of 5
Tell the story over time
What changed this year, and what came before people left?
- The biggest movers, in words Ethnic minority representation up 4.4 points, absence up 0.3 points, women in leadership down 0.6: the chapter opens with what moved most.
- Rated against your targets Every measure that has a target is rated red, amber or green; the rest are shown without a verdict.
- Follow any line to the page behind it The open links take you to the screen with the detail, with your filters kept.
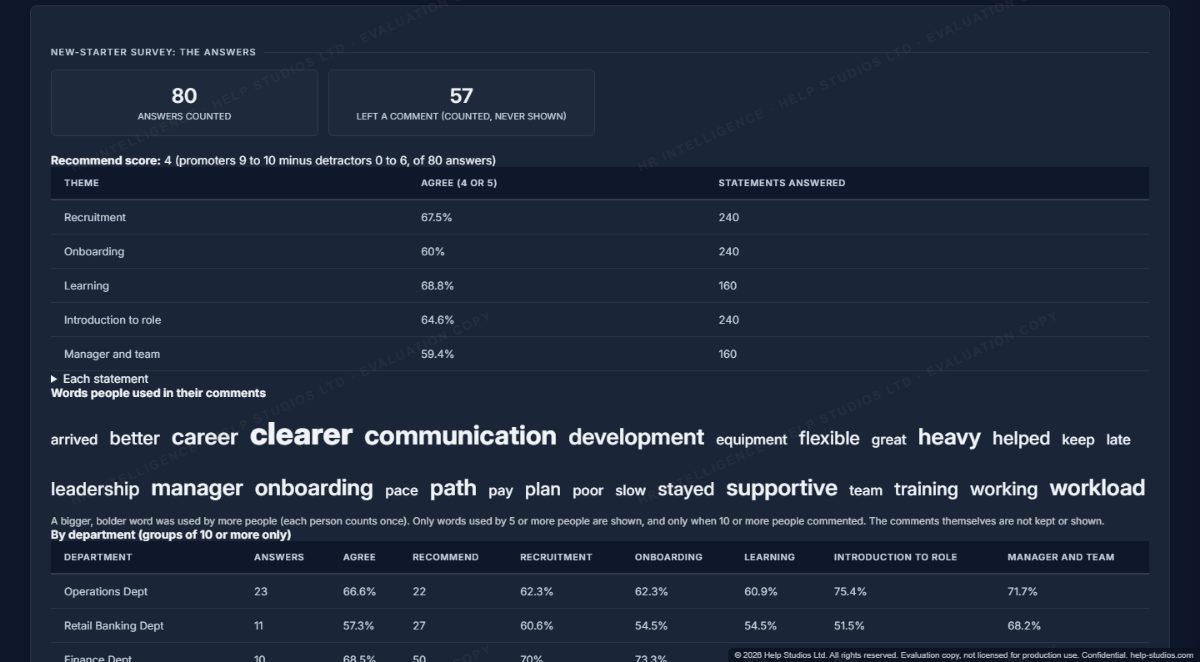
Step 5 of 5
Hear from your people
What did the new starters say, and is it enough to trust?
- A score with its base The recommend score is shown with how many answers it comes from, so you can judge how far to trust it.
- Words, never comments A bigger, bolder word was used by more people. The comments themselves are not kept or shown.
- Small groups protected The smallest group a result may describe is a setting your organisation chooses; a group below it is folded into others so it cannot be found by subtraction.
Demo data — Meridian Bank, a synthetic organisation. The numbers on every step come from one run of the product.
See more
Every screen, and how it fits your reporting.
Talk it through
Start with the question your board keeps asking, or the data problem behind it.